Aftershocks
Visit the live site(opens in a new tab)A squeeze detector for crypto. A measurement, not a prediction.
Coil measures how tightly a coin's price has wound up. Break marks when it lets go.
Four free TradingView scripts and a Telegram bot that messages you when Coil reaches 90. It reads closed candles only and never predicts. Reading a chart is reading a chart: the habits that find a squeeze on TradingView find a drop-off in GA4.
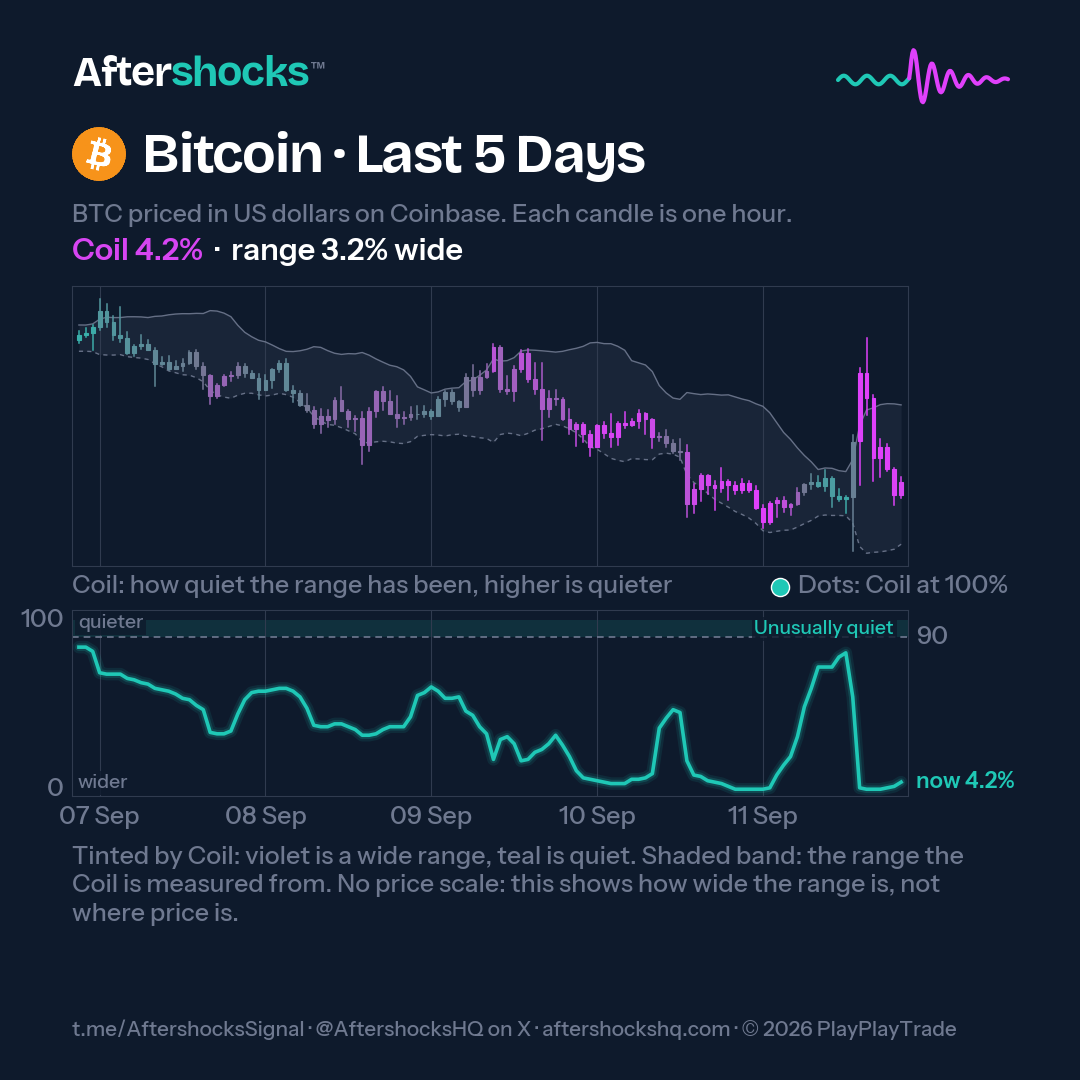
Bitcoin with a wide range. An example drawn from Coinbase prices, 7 to 12 September 2026, not a live reading. 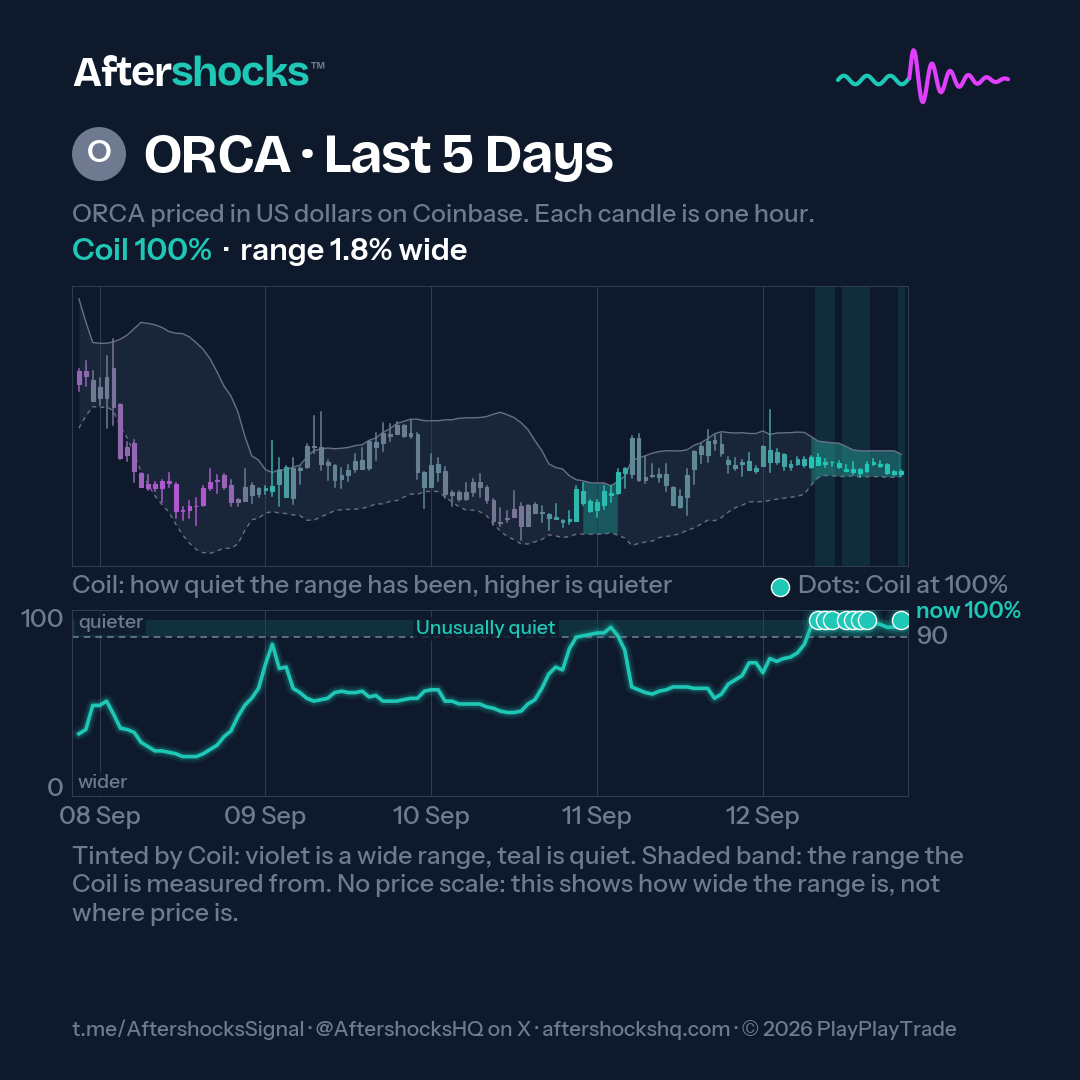
ORCA going quiet. An example drawn from Coinbase prices, 7 to 12 September 2026, not a live reading. 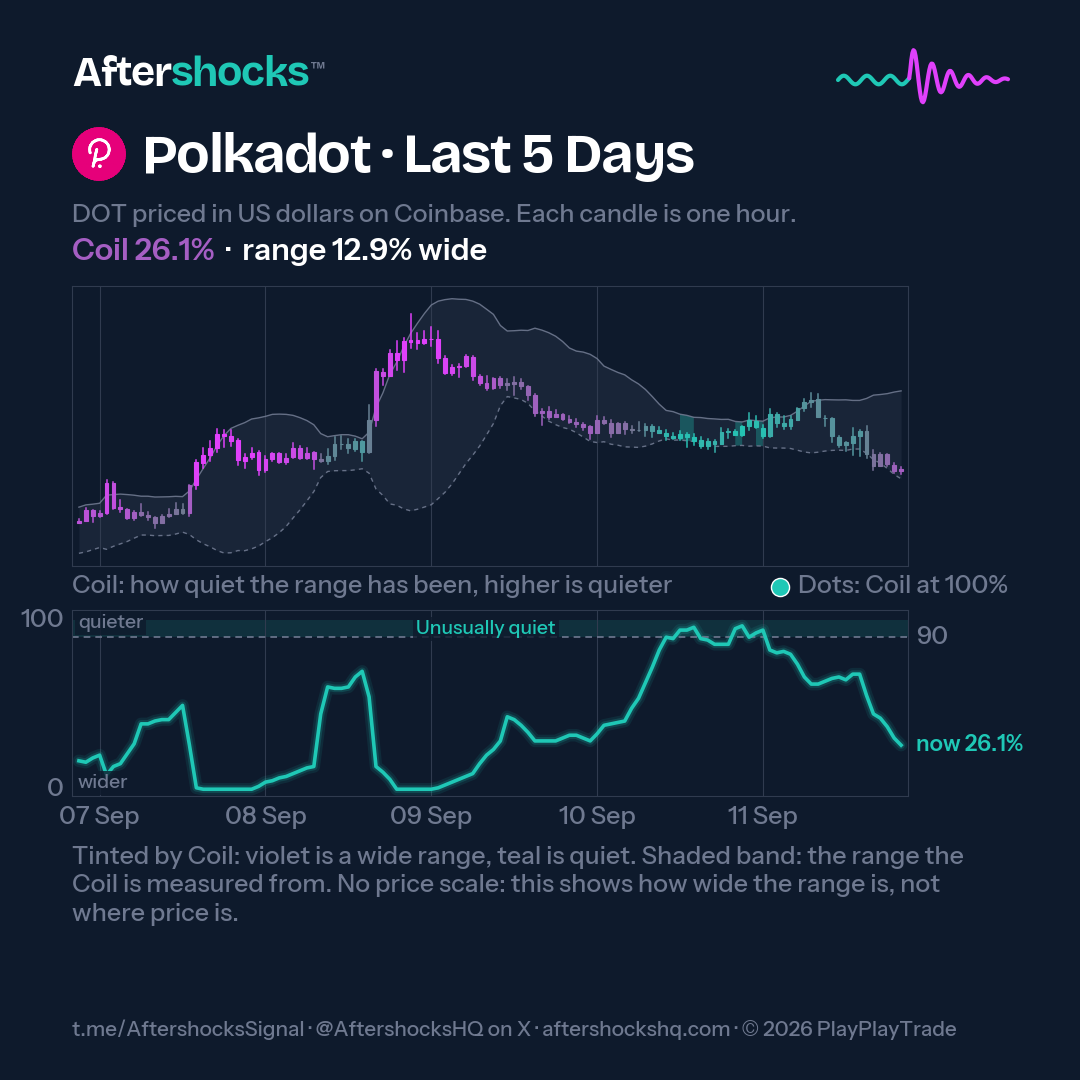
Polkadot with a wide range. An example drawn from Coinbase prices, 7 to 12 September 2026, not a live reading. 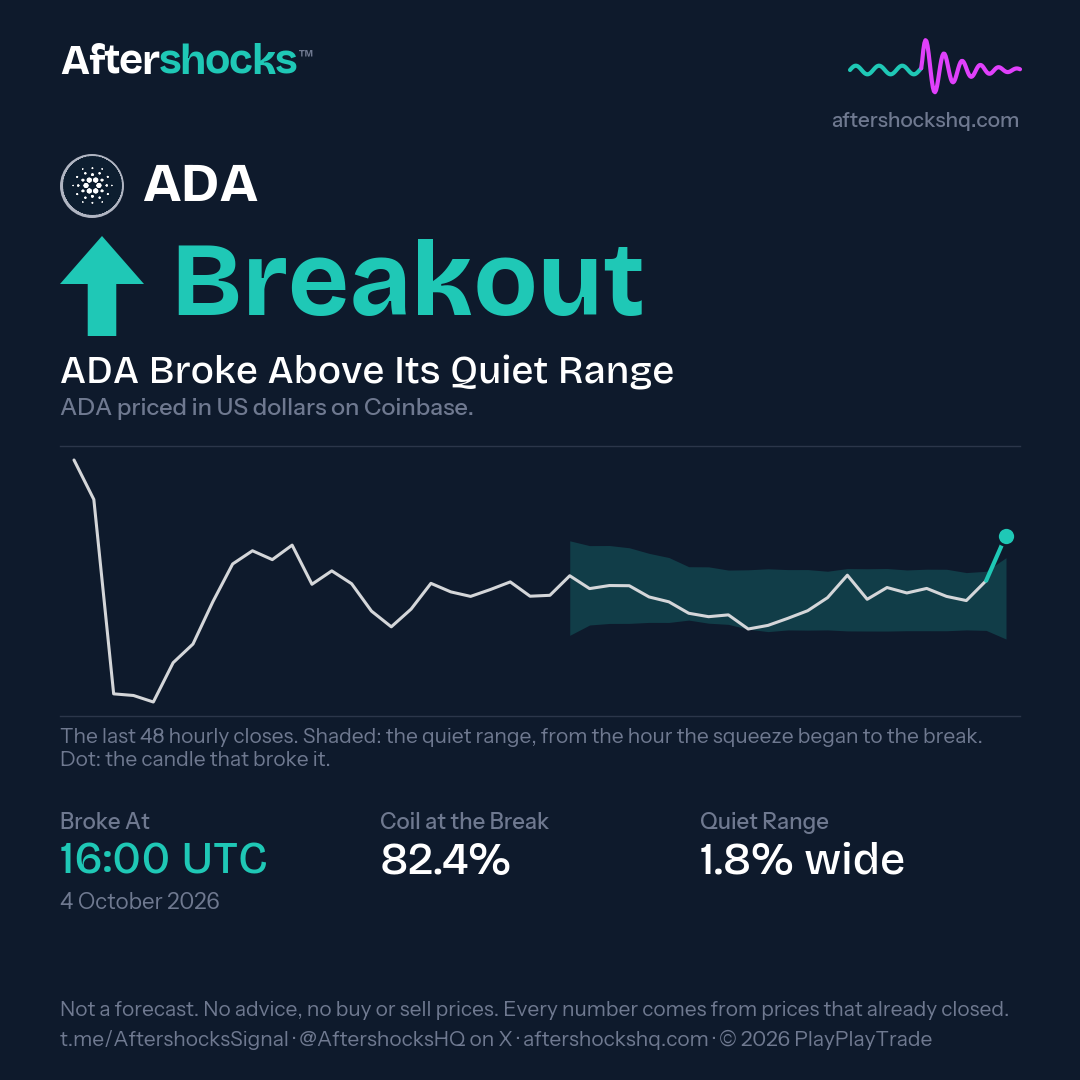
A Breakout card for Cardano. An example drawn from Coinbase prices, 4 October 2026, not a live reading.
What it’s made with
- Python
- Pine Script
- Telegram